
LinkedIn Outreach · How-to guide · Measurement framework
4 LinkedIn outreach metrics to track
Treat LinkedIn outreach as a single funnel: connection requests sent, connections accepted, replies, campaign-defined next steps, and meetings booked. Define the denominator, observation window, and prospect-level counting rules before comparing rates; otherwise, the same campaign can look healthy or weak depending on how each rate is calculated.
Key takeaways
- Count unique prospects at each funnel stage. Message totals make follow-up-heavy campaigns look worse than they are.
- Show both stage-to-stage rates and end-to-end rates. The first reveals the bottleneck; the second shows the campaign's overall conversion rate.
- Next-step progression is not a click or a booked meeting. Define the campaign's next-step event before launch and report meeting bookings separately.
Written by
Kachilu Research
Product research and editorial team
Reviewed by
Tatsuro MatsuzakiCTO at Kachilu
Has more than 1,000 LinkedIn followers and practical expertise in LinkedIn recruiting and sales outreach.
Use four LinkedIn outreach metrics with explicit denominators
A useful dashboard starts with events, not percentages. Record one event per unique prospect at each stage, then calculate the rate only after every prospect in the cohort has had the same observation window.
The recommended denominators below support comparisons across campaigns when the event definitions and observation windows are also consistent. Add a stage-to-stage view when you need to diagnose where prospects stop progressing.
| Metric | Recommended formula | Diagnostic view |
|---|---|---|
| Connection request acceptance rate | Unique prospects who accepted ÷ connection requests that completed the observation window | Compare by ICP, region, sender, and request variant. |
| Reply rate | Unique prospects who replied ÷ accepted prospects who were sent an initial message | Track positive reply rate separately, and show replies ÷ all initiated approaches for end-to-end yield. |
| Next-step progression rate | Prospects who reached the campaign-defined next step ÷ unique prospects whose outreach was initiated | Also show prospects who reached the next step ÷ prospects who replied. |
| Meeting booking rate | Prospects who booked a meeting ÷ unique prospects whose outreach was initiated | Also show booked meetings ÷ prospects who reached the next step. |
Why the denominator changes the meaning of a reply or meeting rate
A reply rate based on accepted connections answers a message-quality question. A reply rate based on every initiated approach answers an end-to-end efficiency question. Both can be useful, but they are not interchangeable.
Use unique prospects rather than messages as the counting unit. If one prospect receives three follow-ups, the campaign still has one prospect in the denominator and at most one prospect who replied in the numerator.
- Name the denominator beside every rate, including charts and exports.
- Anchor cohorts to one date, such as the connection-request date, and use the same observation window.
- Exclude requests that are still within the observation window from finalized rates.
- Separate InMail, connection requests, and post-acceptance messages because their events and delivery conditions differ.
Example: one cohort, two views of the same funnel
Assume a hypothetical cohort contains 1,000 unique prospects. Each initiated approach produced one connection request, every request completed the same observation window, and every prospect who accepted received one initial message. The figures below illustrate the calculation method; they are not Kachilu results or industry benchmarks.
| Funnel stage | Unique prospects | Stage-to-stage rate | End-to-end rate |
|---|---|---|---|
| Outreach initiated | 1,000 | — | 100% |
| Requests with a completed observation window | 1,000 | 100% of initiated outreach | 100% |
| Connections accepted | 300 | 30% of requests | 30% |
| Prospects who replied | 60 | 20% of accepted prospects | 6% |
| Prospects reaching the next step | 18 | 30% of repliers | 1.8% |
| Meetings booked | 6 | 33.3% of next-step prospects | 0.6% |
Build a dashboard that stays comparable over time
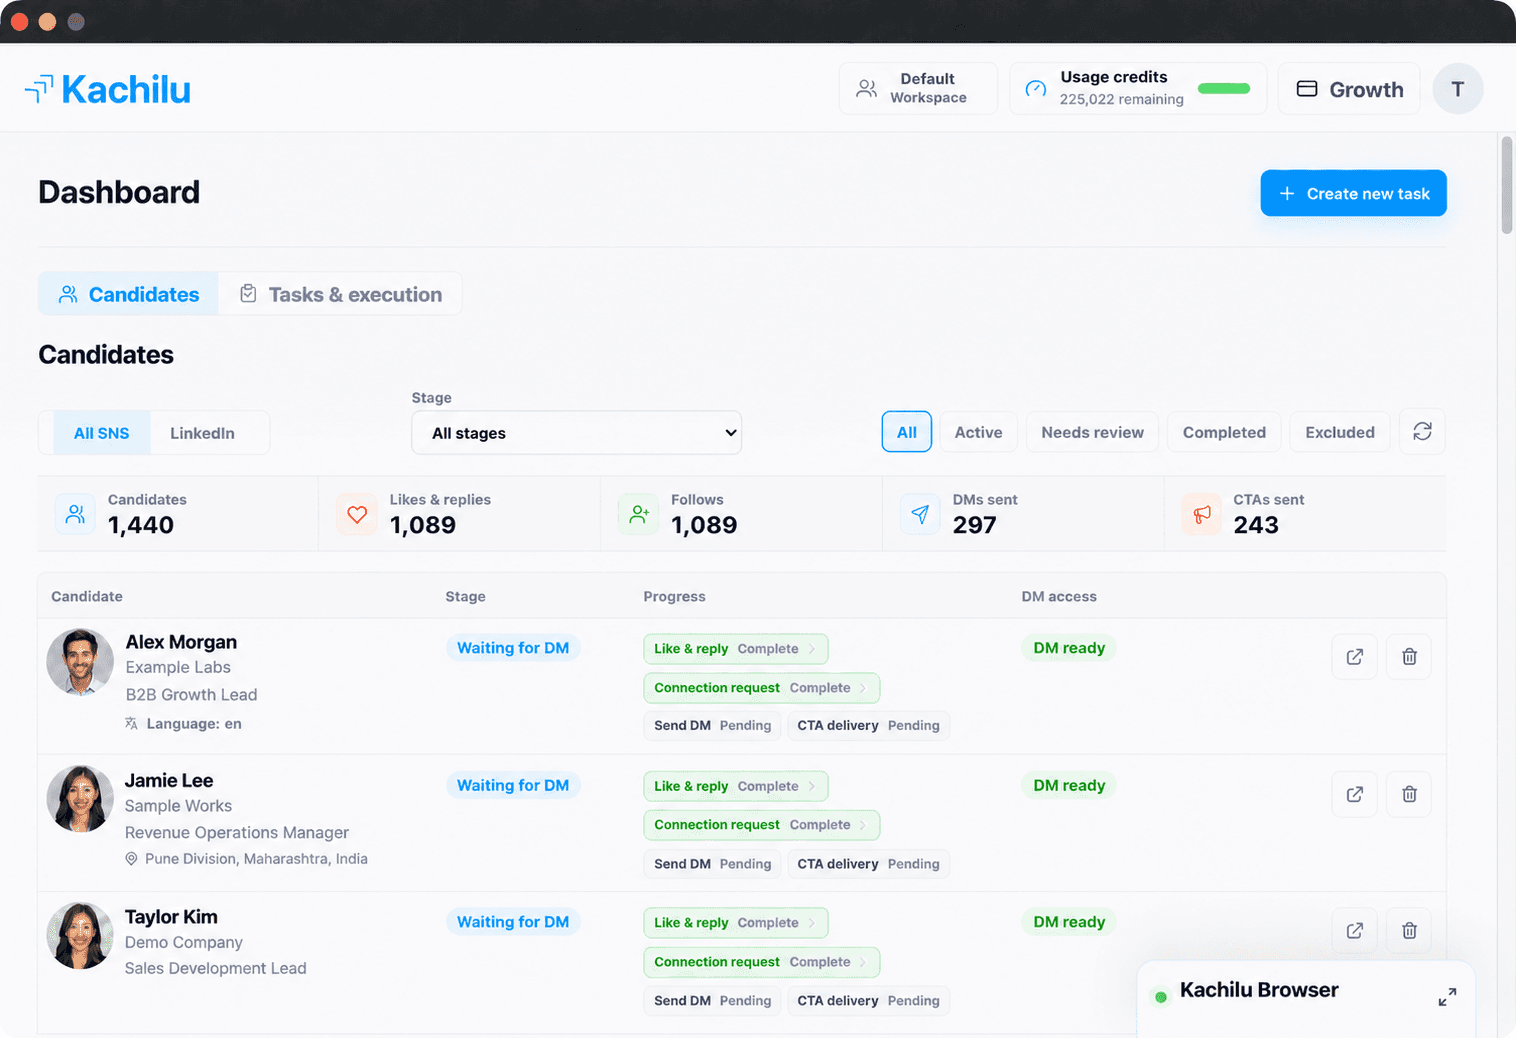
Once the formulas are defined, make the underlying activity visible. Kachilu shows each prospect's current stage and whether engagement, connection requests, DMs, and CTA delivery are complete or pending. Teams can see where outreach is progressing and where follow-up is needed.
- 1.Define each success event before launch: accepted connection, any reply, positive reply, next-step stage, booked meeting, and attended meeting are separate events.
- 2.Record the timestamp of each event for each prospect. Also record the campaign, sender, ICP, region, and message variant associated with that event.
- 3.Choose one cohort anchor and observation window. Finalize the cohort only after that window has elapsed.
- 4.Show event counts, stage-to-stage rates, and end-to-end rates together.
- 5.Compare one meaningful segment at a time. An overall average can hide an underperforming ICP segment or an unusually strong sender.
- 6.Record definition changes. Results are not comparable across periods if the next-step definition changes without a clear break in the reporting series.
Use the funnel to choose what to investigate next
A weak rate is a signal, not proof of a cause. Use the checks below to form a hypothesis, then change one major variable at a time.
| Observed pattern | First checks | Do not assume |
|---|---|---|
| Low connection acceptance | ICP fit, profile credibility, request copy, sender and region | Higher volume will solve a targeting problem. |
| Acceptance is stable; replies fall | Initial message, timing, relevance and delivery access | The connection request caused the decline. |
| Replies are stable; next steps fall | Reply classification, offer fit, conversation handoff and proposed action | Every reply signals buying intent. |
| Next steps are stable; bookings fall | Scheduling friction, response speed, calendar availability and qualification | A proposed next step equals a booked meeting. |
Keep platform definitions, campaign definitions, and benchmarks separate
Platforms use different names and denominators for similar rates. HubSpot, for example, reports sequence reply and meeting rates at the contact level and uses its own attribution window for meetings. LinkedIn calls one InMail response metric its acceptance rate; this is not the same as connection-request acceptance. Write the full event name instead of relying on a short label such as acceptance rate.
This article is a measurement framework, not an industry benchmark. Segment mix, account history, offer, region, message, timing, and observation window can all change the result. The framework can identify where a funnel changed; it cannot establish the cause on its own.
Kachilu's beta report is a separate first-party results article. It defines its campaign-specific next-step stage and the limitations of the comparison; do not use that aggregate result as your own baseline.
- HubSpot: Analyze sequence enrollment and performance data
A platform-specific example of contact-level reply and meeting-rate definitions.
- Salesforce: Sales Stage Analysis Conversion
An example of measuring the share of opportunities that progress beyond a stage.
- LinkedIn Sales Navigator: Metric definitions
LinkedIn's terminology for InMail metrics, which should not be mixed with connection-request acceptance.
- Kachilu beta results across 35,292 outreach attempts
A separate first-party report with its own denominator, period, and limitations.
FAQ
Frequently asked questions
What is a good LinkedIn connection acceptance or reply rate?
There is no universal target that applies to every campaign. Establish a baseline from cohorts that have completed the observation window with the same ICP, region, sender type, channel, and observation window, then use external benchmarks only as context.
Should negative replies count in the reply rate?
Yes—if you are measuring whether a prospect replied at all. Track the positive reply rate separately when you need to measure commercial intent, and document the classification rule before reviewing results.
What denominator should a meeting booking rate use?
For the end-to-end campaign rate, use all prospects whose outreach was initiated. For the handoff rate, use prospects who reached the next step or sent a positive reply. Publish both when diagnosing the funnel, and name the denominator beside each figure.
Is next-step progression the same as a CTA click or booked meeting?
No. It means the outreach reached a campaign-defined stage—for example, offering a demo, sharing a scheduling link, or directing the prospect to a service page. Track clicks, form completions, and booked meetings as separate events.
Should InMail and messages sent after a connection is accepted use the same reply rate?
They should normally be reported separately. The sending conditions, trackable events, and platform definitions differ, so combining them can conceal a channel-specific problem.
More Kachilu insights
Original research
LinkedIn outreach results: findings from 35,292 outreach attempts
Read the articlePractical guide
LinkedIn lead generation agencies: costs, services, and in-house alternatives
Read the articlePractical guide